On This Page
January 22, 2026 10 min read
Why Utility Companies Are Replacing Manual Inspections with Drones
When Restoration Hinges on Faster, Safer Inspections
Replacing manual inspections with drones matters when the grid is on the clock. After a summer squall knocks feeders in Queens, your crews are staged, trucks idling, customers calling. Every hour costs roughly $150,000 in penalties, lost revenue, and overtime. The holdup isn’t effort—it’s safe, fast eyes on the fault. We launch in 20 minutes, clear the span, and pinpoint the hotspot before a bucket truck even gets a lane permit.
Or picture a loose facade stone over a Midtown sidewalk at 8 a.m. You need eyes on that cornice now, not in ten days after scaffolding. Each day a sidewalk shed and lane closure runs $8,000–$12,000, plus union overtime and tenant disruption. The risk is public, the clock is brutal. A drone documents the hazard in an afternoon under a sealed safety perimeter. And that’s why the last five years changed the playbook.
By The Numbers
Industry studies estimate dense urban utility outages cost $100,000 to $300,000 per hour, before fines and customer compensation.
Why drones became essential for utility inspections
When outage minutes burn $100,000–$300,000 an hour, the inspection math changes. Aging assets built in the 60s–90s meet harsher weather, faster vegetation growth, and tighter compliance audits. At the same time, qualified lineworkers retire faster than we can hire, and safety expectations keep rising. The result: your inspection workload grows 10–30% year over year while capacity stays flat. That’s why we’re rethinking how you see assets—fast, safely, and with documentation you can defend.
In NYC (New York City), a single nor’easter can trigger hundreds of pole-top checks and miles of conductor patrols in a day. Vegetation cycles tighten after a wet summer, and heat waves push transformers to their limits. Regulators ask for evidence, not anecdotes—geotagged photos, timestamps, and clear defect ratings. Meanwhile, overtime, lift rentals, and traffic control climb. You feel the squeeze: more assets to check, less time, higher stakes. That’s the backdrop for adopting smarter capture, not just more crews.
Utilities now borrow playbooks from construction and facilities teams: standardized capture plans, thermal baselines, and 3D (three-dimensional) models. Our aerial inspection services bring those cross-industry practices into grid operations without disrupting your safety culture.
The manual inspection bottleneck
Manual patrols put people near energized 13 kV lines (kilovolts that can arc), at height, and in bad weather. In NYC you also fight permits, lane closures, and access to rooftops or back lots. Crews wait on bucket trucks, lifts, or road control. Photos vary by person and angle, often without GPS (global positioning system), time, or an asset identifier. Each delay adds outage minutes and audit risk. Costs stack: truck rolls, overtime, lift rentals, and repeat visits when documentation falls short.
After a storm, terrain and debris block right-of-way (the utility corridor) access, so a simple span check turns into a day of detours. For river crossings and rail corridors, you wait on special permits and escorts. In underground networks, vaults flood and ventilation slows entry. Under pressure, documentation slips: phone photos with no location, mixed naming, missing condition ratings. That spills into claims and compliance—auditors want traceability you can’t easily produce, and insurers ask for evidence you don’t have yet.
The bottom line: time, cost, and risk all rise. A single bucket truck roll runs $1,200–$2,500 before overtime; lane closures add $3,000–$6,000 per day. Lift rentals and traffic details push that higher. Permits can add 2–10 days in dense corridors. Meanwhile, inconsistent evidence forces re-inspections, extending outages and exposing crews longer than necessary. It’s not just inefficient. It’s unsafe.
Why incremental fixes keep falling short
Adding crews helps at the margins, but physics stays the boss: you still shoot from ground level with limited angles, in traffic, under time pressure. Helicopters cover distance, yet in NYC airspace they fly high and fast—great for finding poles, poor for seeing hairline cracks. Without consistent, geotagged imagery captured the same way every time, you can’t trend, compare, or prioritize confidently. So work orders wait while risk grows.
More spreadsheets and checklists don’t solve variability. Two inspectors, two lenses, three distances—now your defect photos can’t be compared or measured. Handheld thermal varies with emissivity settings (how surfaces emit heat) and weather, making hotspots hard to rank. Sampling 10% of spans misses outliers you needed to catch. Standardization and geometry-aware capture are the gap. That’s what we change next.
Try a Pilot
Curious what this looks like on your assets? We’ll outline a low-risk NYC pilot you can run in 2–4 weeks.
From pilot to playbook: drones are the default
So what changes when you run that 2–4 week NYC (New York City) pilot? The inspection playbook flips. Use this quick side-by-side to see impacts on speed, safety, cost, data quality, access, compliance, environmental footprint, and downtime.
| Factor | Manual Inspections | Drone Inspections | Impact on Utilities |
|---|---|---|---|
| Speed | Multi-day truck rolls and climbs | Preplanned missions capture multiple assets per hour | Faster restoration planning and dispatch |
| Safety | Work at height near energized equipment | Remote pilots keep people on the ground | Fewer recordables and claims |
| Cost | Overtime, lifts, traffic details, travel days | Lower field time; reusable flight plans | Double-digit operations-and-maintenance savings |
| Data quality | Ground photos, limited angles, variable resolution | 4K RGB (red, green, blue), thermal, LiDAR (light detection and ranging); repeatable routes | Earlier defect detection and trend analysis |
| Access | Terrain, permits, rooftops, and weather delays | Reach remote spans, substations, storm sites | Continuous coverage across dense territory |
| Compliance | Paper-heavy, inconsistent evidence, scattered files | Geo-tagged, time-stamped, standardized | Audit-ready, GIS (geographic information system) integrated records |
| Environmental impact | Truck miles and helicopter fuel burn | Electric/hybrid UAS (unmanned aircraft systems), targeted sorties | Reduced emissions and noise footprint |
| Downtime | Often requires scheduled outages | Many inspections run hot and non-contact | Keep assets online during survey |
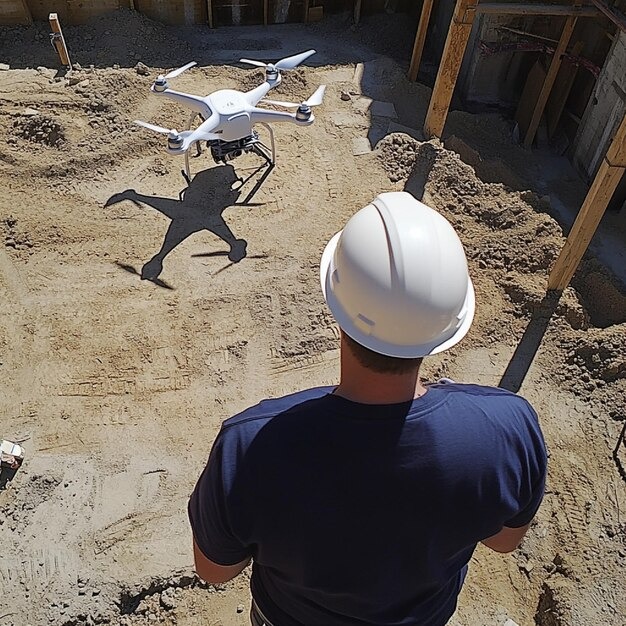
Components of a professional utility drone inspection program
If you expect to keep assets online during the survey, the program behind it has to be rock solid. We fly high-res RGB (red, green, blue) cameras, radiometric thermal (temperature‑calibrated), and LiDAR (light detection and ranging) on RTK/PPK (real‑time/post‑processed kinematic) airframes. Preplanned missions produce orthomosaics (stitched maps), point clouds (3D measurements), and thermal maps that flow into GIS (geographic information system) and asset systems for fast decisions.
Mission planning starts with SMS (safety management system), JSA (job safety analysis), and NYC permits plus LAANC (Low Altitude Authorization and Notification Capability, the FAA—Federal Aviation Administration—real‑time airspace approval system). We define shot sheets, geofencing, and failsafes; collect GCPs (ground control points) when needed; and validate with calibration targets. Processing uses photogrammetry, PPK corrections, and standardized metadata with QA/QC (quality assurance/quality control) gates. Deliverables land in your CMMS (computerized maintenance management system) and GIS with asset IDs, structure numbers, circuit spans, and exports for ESRI (ArcGIS) and Autodesk.
You receive defect imagery, annotated maps, 3D (three‑dimensional) reconstructions, and analytics dashboards aligned to asset IDs and circuit spans—complete with severity, location, and recommended action. It’s audit‑ready evidence you can brief in minutes and defend months later. Next, we’ll show the step‑by‑step.
Cross‑asset consistency matters: the same capture standards we use on utilities also power our drone building inspection workflows, so your buildings and lines share naming, indexing, and change‑tracking across one portfolio.
- RTK/PPK accuracy for sub-decimeter alignment
- Thermal analytics to detect hotspots and load anomalies
- LiDAR for clearance, encroachment, and sag analysis
- Standardized shot sheets and metadata for QA/QC
Secure cloud portals with role-based access - GIS-ready exports for ESRI and Autodesk workflows
A step-by-step plan to launch utility drone inspections
So how do you turn those GIS-ready exports into field reality? Run a 2–4 week NYC pilot across operations, safety, GIS (geographic information system), and legal, with airspace and permit approvals planned upfront.
Step 1: Discovery & Scope: Align goals and assets. Define success metrics, data outputs, and timelines—for example, 40 poles, 2 substations, thermal plus RGB, with 10‑day reporting.
Step 2: Airspace & Safety: Secure LAANC (real‑time FAA approval), NYC takeoff/landing permits, and site safety plans. Align with SOPs (standard operating procedures); confirm barricades, observers, and comms.
Step 3: Mission Design: Build shot sheets; set RTK (real‑time kinematic) bases or network. Define standoff, altitudes, and no-fly buffers, plus weather/load contingencies and reshoot criteria.
Step 4: Flight Operations: Execute on‑site checklists; brief dispatch; set perimeter. Fly with live monitoring; capture QC (quality control) frames; record deviations and incidents immediately.
Step 5: Processing & QA: Run photogrammetry (turn images into maps/models), thermal calibration, and metadata checks. Triage anomalies by severity and location; flag urgent hotspots for same‑day review.
Step 6: Integration & Action: Sync to GIS and CMMS (maintenance system). Generate work orders with evidence, set baselines for change detection, and schedule follow‑ups or outages needed.
The playbook mirrors our drone construction inspection workflow—standardized capture, safety gates, and fast reporting. That consistency lets portfolios scale smoothly. Next, a quick before/after so you can see the time and cost impact.
NYC pilot: before/after results you can defend
That quick before/after we promised? We ran it on a 2–week NYC pilot after a summer storm. Baseline: manual climbs, bucket trucks, and a helicopter spot check over 18 feeder miles; three crews spent two days just to triage. Then we deployed drones with RGB (red, green, blue) imaging and radiometric thermal (temperature‑calibrated) on RTK (real‑time kinematic) airframes from micro launch sites. Restoration planning moved up by 4 hours, inspection throughput doubled (2.1x), and field exposure hours fell by 65–70%. In plain English: you restored service faster, with fewer people at height, and evidence you can show your regulator.
On the building side, a 30‑story Midtown envelope was slated for rope access and scaffolding. Baseline: three weeks of setup, daily lane closures, and inconsistent phone photos. We captured the full facade in one day using oblique RGB (angled visible imagery) plus thermal, with RTK control for measurement‑grade models. The team flagged 42 spall risks and three moisture ingress zones; per‑elevation inspection time dropped 58%, and per‑elevation cost fell 28–35%. Because every image was geotagged and time‑stamped, the QEWI (Qualified Exterior Wall Inspector) brief and DOB (NYC Department of Buildings) packet were ready in 72 hours. Net effect for you: fewer sheds, faster decisions, and prioritized repairs. Next, how we protect accuracy and chain‑of‑custody so these gains stick.
- Result: Inspection cycle time reduced by ~60%.
- Result: Field risk exposure hours cut by ~70%.
- Result: Per-mile inspection costs decreased by ~25–35%.
- Result: Priority defect detection lead time improved by ~3x.
Precise data that flows into your utility systems
That 3x faster detection only matters if the data is precise and traceable. We fly RTK (real-time kinematic) and PPK (post-processed kinematic) so imagery and LiDAR (light detection and ranging) align within 1–3 cm absolute and sub-centimeter relative. Why care? Sub-centimeter alignment means you can measure conductor sag or facade displacement confidently, not estimate. Every mission follows a shot plan with GCPs (ground control points, surveyed targets) where needed, then we export ArcGIS-ready rasters and point clouds and Autodesk-friendly linework and models. Flights, sensor settings, and positions are time-stamped, and we tag each capture with asset IDs, coordinates, weather, and load conditions. For vegetation management, we generate clearance bands and change maps so you can prioritize spans before growth encroaches. It’s consistent, repeatable, and audit-friendly.
Now, how do you defend those results months later? Chain-of-custody. Each file carries immutable metadata (camera, time, location) and sits in a hashed archive (a cryptographic fingerprint that shows if anything changed). We enforce QA/QC (quality assurance/quality control) gates: target ground sampling distance, reprojection error thresholds, and sample audits on 10% of outputs. Deliverables drop directly into your GIS (geographic information system) feature classes keyed to CMMS (computerized maintenance management system) asset IDs, so work orders link to the exact photo, thermal tile, or LiDAR slice. Example: pole 14‑07‑233, span B, 40.7441/‑73.9353, thermal hotspot 12.6°F over baseline, clearance 18 inches—ready for a planner without a translation step. Less rework. Faster closeout. Clean audits.
The same accuracy underpins our drone facade inspection service, where centimeter-scale models index cracks, spalls, and sealant by elevation and grid. Next, we’ll show how our safety system and governance keep every flight, perimeter, and permit buttoned up in NYC.
People, protocols, and protections behind every flight
So how do we keep every flight, perimeter, and permit buttoned up in NYC (New York City)? We start with FAA (Federal Aviation Administration) Part 107 compliance—the small‑drone commercial rule—and layer in a safety system built for New York streets. Our SOPs (standard operating procedures) and hazard analyses (identify risks, set controls) drive planning, not paperwork. Aviation‑grade checklists cover preflight, launch, landing, lost‑link (signal loss), and emergency procedures. Since 2018, we’ve run complex urban missions—Midtown facades, waterfront substations, tight courtyards—without putting people where machines can go. What does that look like on the ground? Pre‑briefs with roles and abort criteria, airspace and NOTAM (notice to air missions) checks, weather minimums, and mapped contingency landing zones. Experienced UAV (unmanned aerial vehicle) pilots and trained visual observers work as a unit. The result is predictable execution. Fewer surprises.
Urban controls are non‑negotiable. We build JSAs (job safety analyses), site‑specific SMS (safety management system) plans, and public safety perimeters into every mission. In practice, that means barricades and signage, spotters at the corners, radio comms, and pedestrian reroutes coordinated with building security and site safety managers. Permitting lives in the same playbook: NYC (New York City) takeoff/landing permits, LAANC (Low Altitude Authorization and Notification Capability, real‑time airspace approval), and Remote ID (broadcast identification) compliance. We carry COIs (certificates of insurance), maintain flight logs and telemetry, and file post‑mission reports you can share with risk, legal, and regulators. Example: for a Midtown avenue facade survey, we staffed two observers, kept a clear buffer to the public, and paused between bus cycles. Safe, disciplined, repeatable.
NYC is our proving ground; the same rigor underpins our New York City drone building inspection, where crowded streets and strict compliance reward tight governance.
Connect utility-grade aerial intelligence to building facades
That same rigor carries straight into facades and vertical assets. Instead of swing stages (hanging scaffolds), we fly RTK (real-time kinematic) drones with high‑res RGB (red, green, blue) and radiometric thermal (temperature‑calibrated) to capture full elevations in hours, not weeks. Oblique angles document cornices, parapets, and ornamentation without putting people on ropes. QA/QC (quality assurance/quality control) checklists standardize distance, overlap, and exposure so every image is measurable and repeatable. You get defensible evidence, faster lane reopenings, and fewer tenant disruptions.
We tag cracks, spalls, efflorescence (salt staining), displacement, and sealant failures by grid and elevation. LiDAR (light detection and ranging) provides true-to-size measurements for bowing and out-of-plumb checks; thermal highlights moisture ingress and heat loss. Typical 30‑story capture: one day, with a risk‑prioritized defect map you can act on by Monday. For LL11 (NYC’s Facade Inspection & Safety Program) we index photos to elevations and zones, so your QEWI (Qualified Exterior Wall Inspector) can cite exact locations in minutes.
If you’re preparing for LL11, start with our New York City drone facade inspection overview for scope, permits, timelines, and sample deliverables.
Drone documentation aligned to NYC LL11/FISP compliance
So what does that LL11 (Local Law 11) prep look like in practice? We deliver standardized, geo-tagged, time-stamped imagery indexed by elevation and zone, plus defect tables your QEWI (Qualified Exterior Wall Inspector) can cite. Each entry reads: Zone 14B, crack 3.2 mm, parapet; photo XYZ; coordinates; condition rating. That package speeds FISP (Facade Inspection & Safety Program) submissions and turns reports into clear remediation plans and bids.
Because New York City Local Law 11 runs on five-year cycles, drone baselines and repeat captures make periodic filings faster, cheaper, and more consistent. We standardize across buildings, so your portfolio rolls into a single dashboard and predictable inspection cadence.
Aerial building inspections at portfolio scale
That single dashboard is only useful if every building is captured the same way. We standardize flight plans, distances, and metadata so you get fast condition baselines, 72‑hour reports, and risk‑prioritized repair lists across 30–50 properties. Annual or biannual flythroughs take one day per tower, giving you consistent, defensible records you can compare year over year.
Want a clear starting point? See our New York City aerial building inspections overview, then pick a compliance bundle, rapid‑response scan, or portfolio subscription that fits your timeline.
NYC building inspection service tiers and benefits
So what do those bundles look like in practice? We offer three tiers: recurring programs that baseline each facade annually with 72‑hour reports; emergency callouts mobilized in 24–48 hours for hazards; and compliance documentation packages that turn findings into contractor-ready scopes. Expect fewer sheds, faster reopenings, and 30–60% lower inspection costs compared to scaffolding.
See package details and sample deliverables in our New York City drone building inspection services, then keep the momentum going with construction progress capture and 3D (three-dimensional) as‑builts.
Drone progress monitoring for complex NYC jobsites
We keep that momentum on site with weekly orthomosaics (stitched site maps) and 3D (three-dimensional) models that lock schedule to reality. You verify percent complete, check install locations, and catch clashes—steel versus mechanical, electrical, plumbing—before they burn weekends. Typical capture: a 20‑minute flight, same‑day ortho, and clash notes by 10 a.m. next day; rework drops 20–30%. All with the same utility‑grade safety, permits, and quality controls.
See how our New York City drone construction inspection runs weekly playbooks, sample deliverables, and safety controls—then we’ll map a pilot.
Why AeroSpect NY: NYC Drone Inspection Specialists
You’re ready to map that pilot—here’s why teams choose us. Since 2018, we’ve flown New York with RTK/PPK (real-time/post-processed kinematic) positioning, LiDAR (light detection and ranging), and radiometric thermal (temperature‑calibrated thermography) to deliver measurement‑grade models and hotspot maps you can act on. Our FAA Part 107 team (the U.S. commercial drone rule) includes seasoned UAV (unmanned aerial vehicle) pilots and trained visual observers who manage NYC takeoff/landing permits, barricades, and public safety perimeters without slowing your schedule. The payoff is concrete: same‑day capture, 72‑hour reporting, and 30–60% lower inspection costs versus scaffolding, rope access, or helicopter patrols. You get millimeter‑level visuals, obliques for hard‑to‑reach details, and defensible evidence with timestamps, geotags, and clear defect ratings.
We pair innovation with disciplined reporting. Deliverables include annotated defect maps, 3D (three‑dimensional) models, thermal tiles, and time‑series comparisons tied to asset IDs and locations—ready for BIM (building information modeling), CMMS (computerized maintenance management system), and project platforms. In practice, that means a 20‑minute briefing can move a planner to work orders the same day. Safety stays non‑negotiable: SMS (safety management system), JSAs (job safety analyses), incident reporting, and insurance documentation are built into every mission. And because this is New York, our crews know tight courtyards, busy avenues, and rooftop launches—without surprises. Whether it’s a 30‑story facade with a QEWI (Qualified Exterior Wall Inspector) or a storm‑hit substation, we deliver fast, defensible decisions. Ready when you are.
You’re Ready—Let’s Launch Your NYC Pilot
Ready when you are? Let’s map a no‑risk pilot that goes live in 2–4 weeks. We’ll tailor the call or demo to your role—asset managers, safety leaders, or GIS (geographic information system) teams—so you see the workflows, data, and ROI (return on investment) that matter to you.
Also Available
Prefer a preview? Request a sample report or our LL11 (NYC Local Law 11) Drone Documentation Checklist—typical turnaround 48–72 hours.
Get Expert Help
Let's discuss your site and timeline
Message Sent!
Thank you for reaching out.
We'll get back to you shortly.