On This Page
January 22, 2026 10 min read
High-Quality Drone Data for GIS Workflows
The GIS Insight Gap Starts at the Source
Why do good GIS projects still fail? Picture a polished GIS (geographic information system) dashboard showing every façade elevation green. The crew rolls out, closes a Midtown lane, and discovers the orthomosaic (a stitched aerial map) was three weeks old—the spall (concrete flaking) spread and access changed. Hours lost, permits ticking. The software didn’t fail; the source did. We see AEC (architecture, engineering, and construction), facilities, and legal teams hit the same wall: stale, noisy capture sneaks in before analysis.
Or the map lines up perfectly—just in the wrong place. A bad CRS (coordinate reference system) choice can shift assets 3–6 feet; we’ve walked AEC, facilities, and legal teams back from Web Mercator (a web map projection) on State Plane EPSG:2263 (Long Island feet) jobs. That means reshoots, night overtime, and DOT (Department of Transportation) permits. Your GIS wasn’t wrong; the inputs were. At AeroSpect NY, we spot these pre-analysis gaps before they land on your job ticket.
What High-Quality Drone Data Actually Means for GIS
If noisy, stale, incomplete sources mislead, then quality needs a shared definition. We use five pillars: accuracy (how close to truth), currency (how fresh), completeness (what’s covered), consistency (uniform capture), and lineage (provenance). Each ties to choices you control: sensor selection, flight altitude, overlap patterns, surveyed control, camera calibration, and correct datums/coordinate systems. Get these right before takeoff and your GIS stays honest.
These pillars decide whether your layers drop into ArcGIS or QGIS without rework—and whether decisions land on time. Accuracy and completeness affect measurements; currency drives permit and FISP deadlines; consistency prevents stitching artifacts; lineage proves what happened, when, and why. Practically, that means disciplined capture plans, documented settings, and metadata that states coordinate systems, vertical reference, and processing versions. Tight inputs today save you days tomorrow.
Use this quick checklist to grade any dataset before you import it into your GIS:
- Accuracy: State horizontal/vertical tolerances with units and RMSE (root mean square error) against check points.
- Currency: Capture date and time matched to your decision window (e.g., last 48–72 hours).
- Completeness: AOI (area of interest) coverage, point density/overlap, and required classification levels confirmed.
- Consistency: Uniform overlap, GSD (ground sample distance), exposure, and flight altitude across sorties.
- Lineage: Traceable sensor IDs, control, processing parameters, software versions, and change history.
Where Drone-to-GIS Projects Go Off the Rails
Most failures start before analysis: datums/epochs misaligned, weak or sparse control, poor overlap, and soft GSD. Add rolling shutter (sensor distortion during motion), RTK/PPK drift (GNSS corrections that wander), and bloated files. Result? A crisp façade model that looks perfect yet is shifted 2.3 feet—wrong vertical reference moved defects off their anchors, forcing a reshoot and two nights of NYC lane closures.
Downstream, teams chase ghosts: measurements don’t match survey, elevations disagree across layers, and coordinates fight each other. Without solid control and declared vertical reference, your beautiful orthomosaic becomes an unreliable ruler. The visuals sell confidence; the numbers betray it. That’s when confusion turns into rework, delays, and costly permits.
Summarize the most common failure modes that later cause rework:
- Coordinate chaos: Wrong CRS (coordinate reference system)/vertical datum, mixed WGS84 (global) vs NAD83 (North American), ellipsoid vs orthometric.
- Control gaps: Too few or poorly distributed GCPs (ground control points); base logs missing or mis-timed.
- Acquisition drift: Inconsistent overlap/exposure, wind-induced blur, variable altitude—uneven GSD and geometry.
- Density illusions: Pretty orthos with point density too low to support linework or measurements.
- Software strain: Monolithic rasters/point clouds with no tiling or pyramids (overviews) for performance.
- Metadata holes: Missing capture logs, sensor IDs, accuracy statements, and processing notes for traceability.
The Compounding Cost of Bad Inputs
Those metadata holes you just saw—what do they cost on the street? In NYC, a wrong CRS (coordinate reference system) or vertical datum means 1–2 reflight days, 10–25% redraw, 2–4 week schedule slips, and five‑figure change orders. Even a 0.07–0.10 ft (2–3 cm) vertical bias ripples through contours, cut/fill volumes, and clash checks—turning safe clearances into conflicts and misreporting quantities by 3–8%. On a 40‑story façade, a 2 cm horizontal bias drifts anchor locations by inches—enough to misplace defects or drill the wrong spot.
That damage compounds fast. Crews sit idle, subs reschedule, and your project manager burns nights chasing permits for a reshoot. Budgets swell while stakeholder trust thins—especially on FISP (NYC façade law) reports and forensics. The fix is boring and effective: front‑load QC (pre‑flight checks, control verification, and post‑processing validation) so bad inputs never enter your GIS. Preventable. Repeatable.
A Reality‑Accurate Drone Data Pipeline (That GIS Loves)
We answer the cost spiral with a reality‑accurate pipeline that bakes quality in from first call to GIS packaging. It’s seven disciplined steps, not heroics at the end. We tuned it for NYC building façades and accident forensics, and it seamlessly serves broader AEC (architecture, engineering, construction) mapping and monitoring.
Here are the steps so your GIS lead can audit the pipeline today:
Step 1: Discovery & Specs — Define AOI (area of interest), use cases, accuracy targets, CRS/vertical datum (coordinate system and height reference), and delivery formats.
Step 2: Mission Planning — Set altitude, GSD (ground sample distance), overlap/sidelap, flight lines, sun angle; plan control.
Step 3: Control Strategy — Establish survey control (GCPs: ground control points), RTK/PPK (real‑time and post‑processed kinematic) plan, and redundancy.
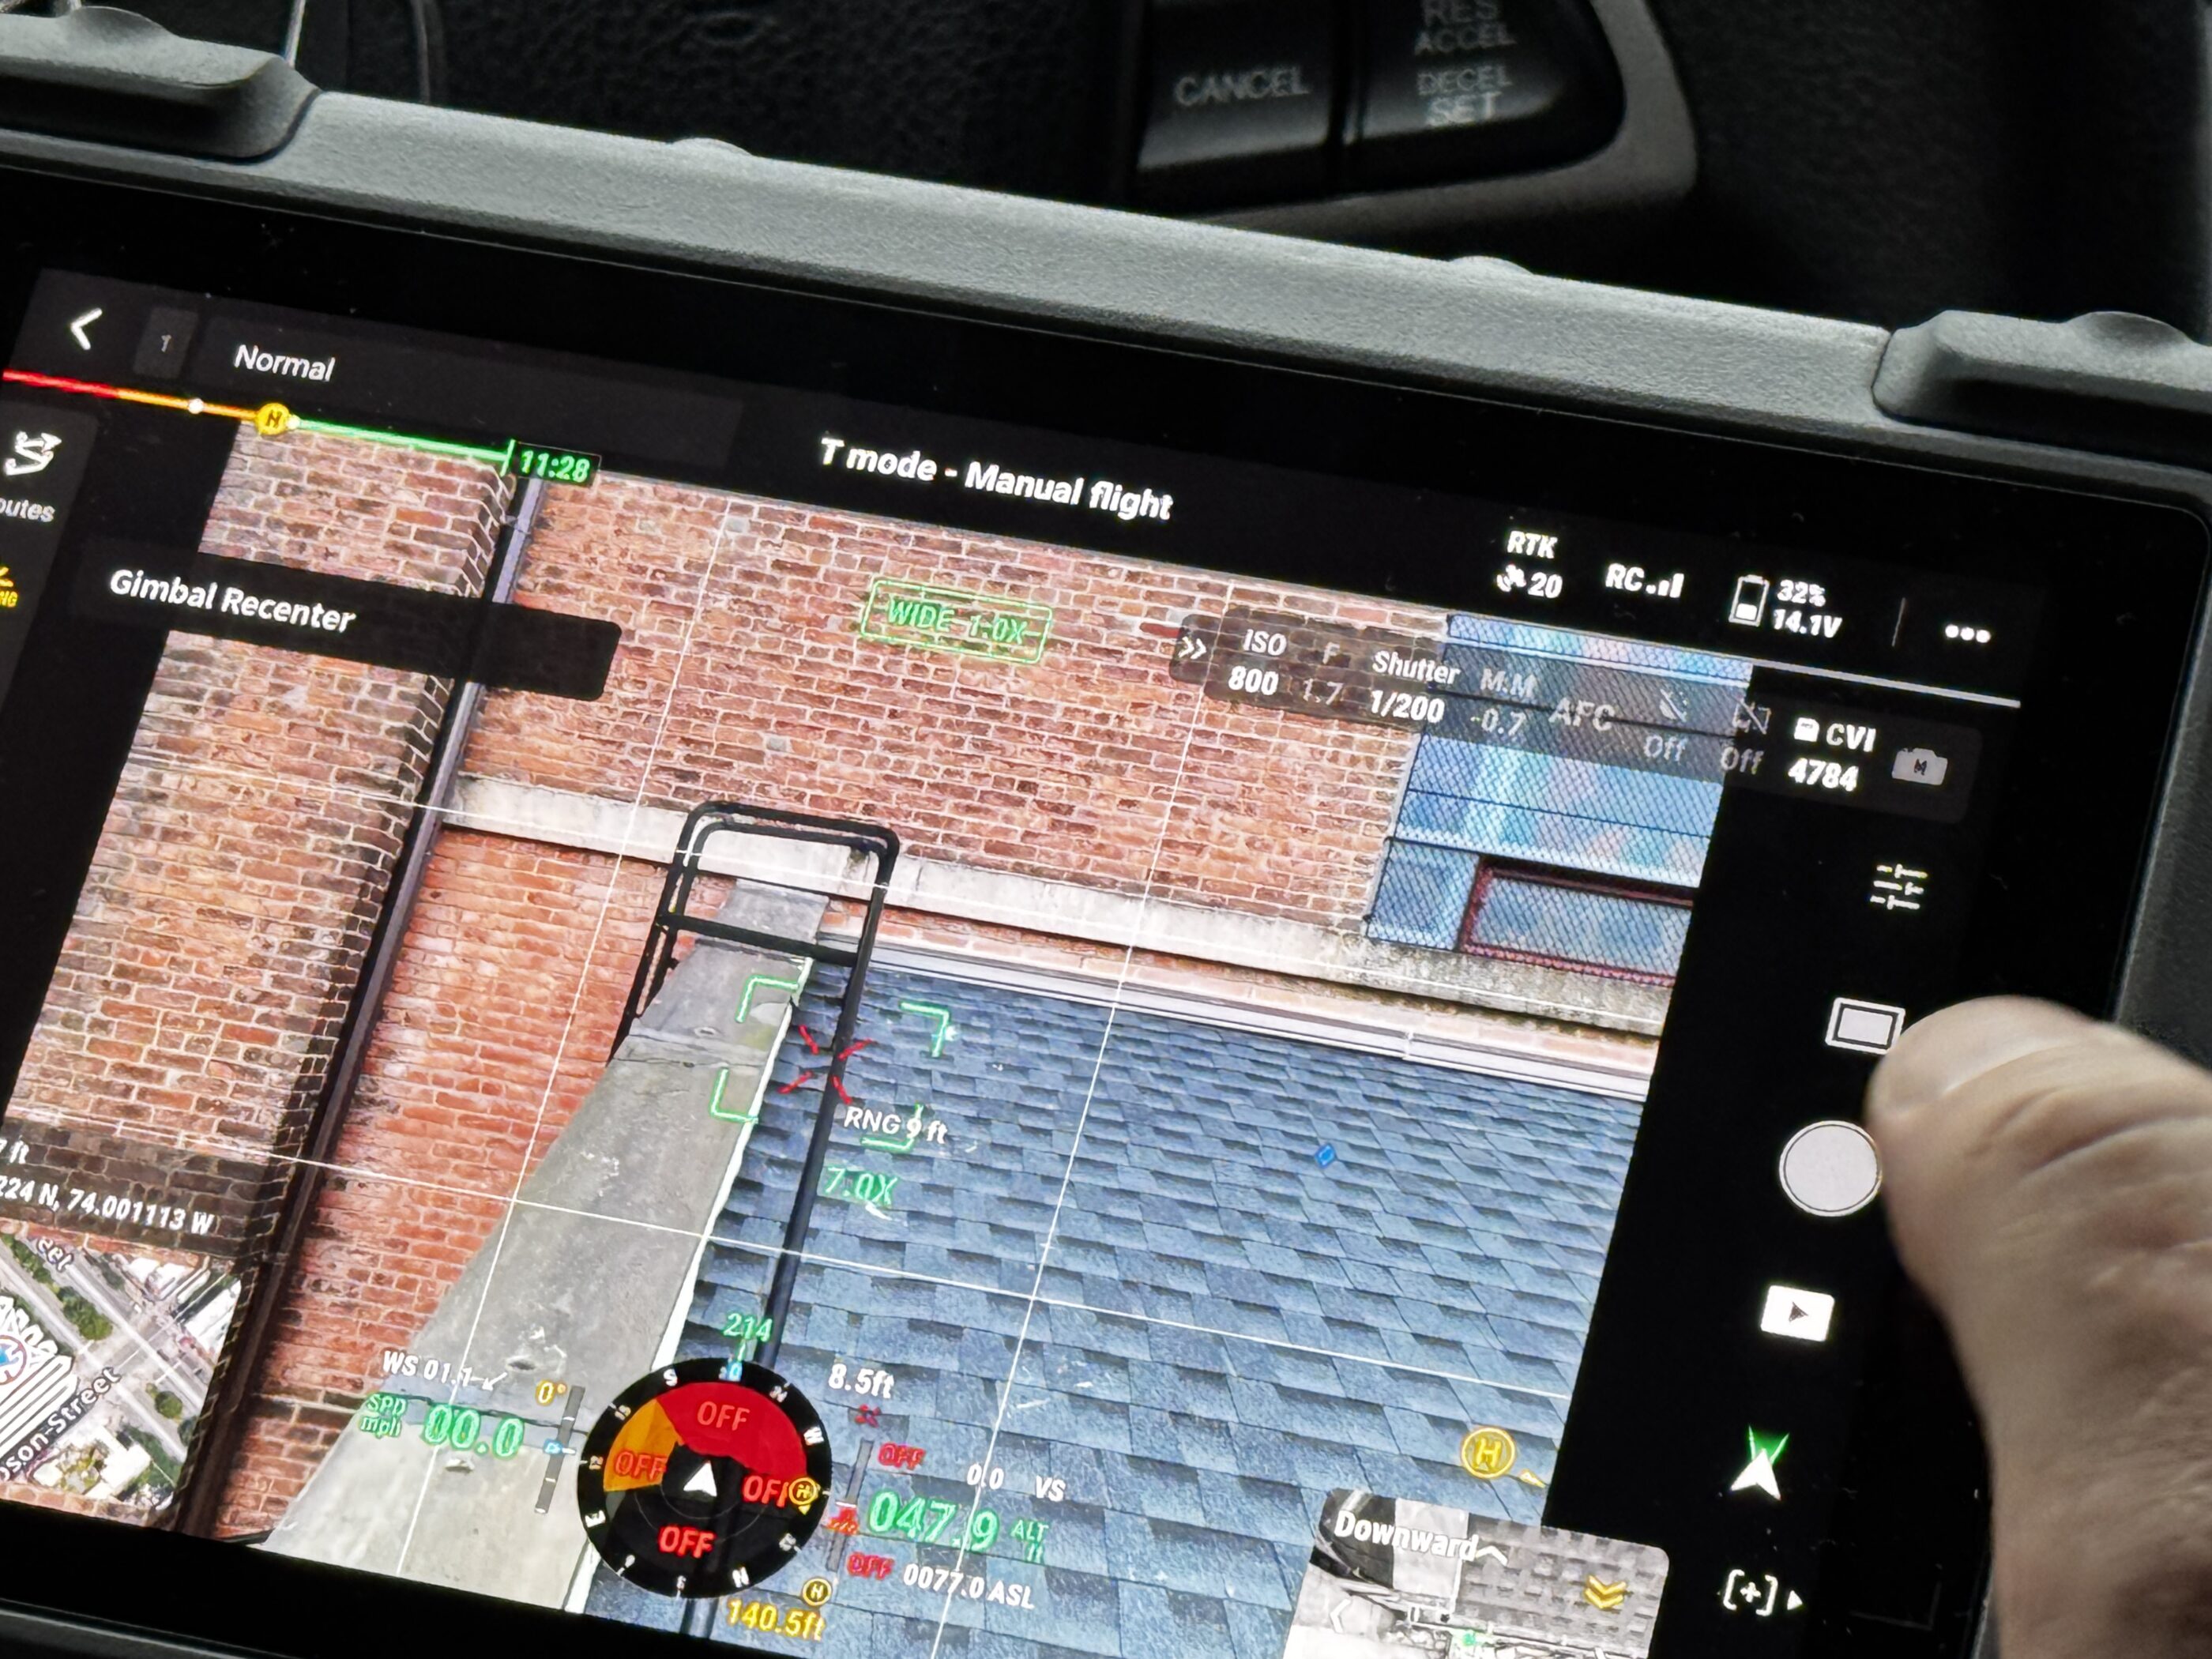
Step 4: Capture — Execute flights with live QC (quality control) checks: coverage, exposure, GNSS (satellite signal) health, wind thresholds, and safety windows.
Step 5: Processing — Calibrate cameras, align, classify; tune densification, de‑noise; apply datum/CRS transforms with versioned settings.
Step 6: QA/QC — Independent checks vs control; compute RMSE (root‑mean‑square error); spot‑check breaklines and features.
Step 7: GIS Packaging — Build COG (cloud‑optimized GeoTIFF) pyramids, LAZ tiles, styles: LYRX (ArcGIS) and QML (QGIS), layer files, metadata PDF, and a readme.
Pick the Right Modality for the Job
Errors die early when you choose the right sensor. Not sure when to pick LiDAR (light detection and ranging) or photogrammetry? This side-by-side prevents over- or under-spec. For façades and linework, LiDAR plus imagery often wins. Units: centimeters (cm) and meters.
| Source | Typical Accuracy | Capture Speed | Relative Cost | Best Use Cases |
|---|---|---|---|---|
| Satellite imagery | 1–5 meters | Very fast | $ (lowest) | Large-area context, change detection |
| Crewed aerial (imagery) | 5–20 centimeters | Fast | $ (moderate) | Regional planning, corridor overviews |
| Ground survey | 1–2 centimeters | Slow | $$ (highest) | Survey control, critical design features |
| Drone photogrammetry | 2–5 centimeters (with ground control) | Fast | $ | Orthos, terrain, volumetrics, progress |
| Drone LiDAR | 2–4 centimeters | Fast | $$ | Vegetation penetration, façades, complex structures |
Need geometry that holds up in New York City urban canyons or interiors? Our LiDAR scanning services fuse cleanly with imagery to deliver audit-ready façades and crisp linework.
Deliverables That Drop Into GIS Without Headaches
You’ve chosen the right sensor mix—LiDAR fused with imagery where it counts. Now we package it for zero drama in your GIS (geographic information system). Orthos ship as COGs (cloud‑optimized GeoTIFFs) with internal pyramids/overviews and proper world files. Point clouds arrive as LAZ (compressed LAS) tiled by city block for predictable loads and fast indexing. 3D comes as I3S (Esri scene layer), SLPK, or OBJ with materials. We include Esri layer packages (.lyrx) and QGIS styles (.qml) so symbols land correctly. Annotations live in a versioned file geodatabase for safe edits.
Performance matters on real machines. COGs stream from web/cloud storage, opening in seconds instead of minutes; LAZ tiles load progressively, so you don’t freeze ArcGIS Pro or QGIS during pans. For web scenes, we publish I3S or 3D Tiles for smooth streaming. We also match your workstation class: 16–32 GB RAM laptops, mid‑range GPUs, and shared networks. Result: 2–5x faster load times in practice and far fewer “not responding” moments during live reviews with principals.
Outline the minimum metadata we include with every deliverable:
- Capture details: Dates/times (UTC), sensor model/IDs, lens, altitude, GSD.
- Control & accuracy: GCP coordinates, RMSE (XY/Z), survey methods, benchmarks.
- Processing: Software versions, parameters, classification notes, transformations.
- CRS: Horizontal/vertical definitions, geoid model, units, epochs.
- Lineage: File hashes, versioning, named contact for questions.
When you’re ready to test this pipeline, our aerial inspection services deliver NYC‑ready capture, packaging, and governance for façades and forensics.
Case Snapshots: Building Assets and Forensics
To show how that NYC‑ready pipeline performs, we ran a Midtown high‑rise façade sweep with LiDAR (light detection and ranging) plus oblique imagery. Vertical RMSEz 2.4 cm (RMSE: root mean square error) and RMSExy 1.3 cm, confirmed by independent check shots. We delivered ArcGIS Pro (Esri’s desktop GIS—geographic information system—software) tiles as SLPK (scene layer package) and COG (cloud‑optimized GeoTIFF) orthos for smooth streaming. Result: you triage defects 30–40% faster—supers zoom elevation by elevation without lockups. Defects were polygon‑mapped and pushed to work orders the same day. If you want this exact playbook, our aerial building inspections follow the same capture, quality control, and packaging steps.
Accident forensics example: within a 45‑minute lane closure, we flew a photo grid and tied in terrestrial LiDAR (light detection and ranging). Output: a centimeter‑grade model, check shots within 2.1 cm, and a time‑stamped chain‑of‑custody with file hashes for admissibility. We overlaid the scene with roadway GIS (geographic information system) layers to compare skid marks and signage in minutes. Turnaround: prelim ortho and point cloud in 4–6 hours; full package—LAZ (compressed LAS), OBJ (3D mesh), measurements, evidence log—inside 24 hours. Up next: the integration guardrails that keep these deliverables plug‑and‑play.
Integration Pitfalls We Preempt (So You Don’t Have To)
You saw the snapshots work; how do we keep them plug‑and‑play in your stack? AutoCAD/Civil 3D (CAD drafting tools) choke on giant rasters, while ArcGIS Pro (Esri’s desktop GIS) streams tiled COGs (cloud‑optimized GeoTIFFs) easily—so we deliver pyramided tiles instead of one 3 GB slab. The bigger trap is heights: ellipsoid (math‑model) vs orthometric (sea‑level) and NAVD88 (North American vertical datum) vs local benchmarks. A wrong transform can shift features by feet. Our validation scripts parse headers, flag CRS (coordinate reference system) mismatches, and halt delivery until fixed.
We front‑load safeguards so you don’t babysit imports. Each delivery includes locked CRS templates (.prj and .wkt files), vertical unit flags, and ready‑to‑apply styles (.lyrx for ArcGIS, .qml for QGIS). We ship VRTs (virtual mosaics) for CAD backgrounds and tiled LAZ (compressed point clouds) with clean headers. Before you see it, we run preflight checks: COG‑validate, lasinfo header audit, scene‑layer integrity, and a three‑tool test import (ArcGIS Pro, QGIS, AutoCAD Map 3D). Result: predictable placement, correct units, and zero “why is this shifted?” calls.
Quick list of friction points we design around:
- CAD scale traps: Deliver reduced, tiled rasters or vectorized linework.
- Desktop crashes: Provide pyramids/overviews and cloud paths for streaming.
- Datum drift: Lock CRS/vertical definitions and include .prj/.vrt templates.
- Time sync: Align flight/control timestamps to UTC (Coordinated Universal Time) with offsets logged.
Data Governance That Scales Beyond One Project
You just aligned timestamps to UTC (Coordinated Universal Time) with offsets logged—great. How do you keep that discipline when new teammates and vendors join? We standardize foldering, naming, SOPs (standard operating procedures), and data dictionaries (your schema guide) so anyone can find, trust, and reuse data in minutes. In practice, onboarding drops from 3 hours to 30 minutes, and rework calls fall 25–40%. Same rules, every project. Less variance. More velocity.
Traceability is your safety net when questions hit. Each delivery carries STAC (SpatioTemporal Asset Catalog) metadata and ISO 19115 fields (international geospatial metadata) plus file hashes (SHA‑256 digital fingerprints) and chain‑of‑custody notes. That means you can answer who captured, when, with which settings—in 60 seconds, not six emails. During audits or FISP (NYC façade law) reviews, this cuts variance across vendors and supports defensible decisions. Next, we publish the KPIs you can hold us to.
Provide a checklist of governance essentials to standardize:
- Versioning: Semantic file versions and immutable hashes (digital fingerprints) for releases.
- Naming: Coordinate reference system (CRS) and epoch embedded in filenames; consistent tile indices.
- Access: Role-based permissions and audit trails for edits.
- Documentation: One-page metadata PDF plus machine-readable JSON (structured text format).
- Retention: Archive policies aligned to legal and operational needs.
Quality Benchmarks & KPIs You Can Demand
With retention and governance locked, what does success look like in numbers? Here's the KPI matrix we commit to—typical NYC targets, why they matter, and how we prove them. Targets adjust by facade vs terrain, interiors, and permitting limits; verification never changes.
| KPI | Typical Target | Why It Matters | How We Verify |
|---|---|---|---|
| Horizontal RMSE (root mean square error) | ≤ 1–2 cm facades; ≤ 3–5 cm terrain with GCPs (ground control points) | Reliable planimetry and linework placement in dense urban contexts | Independent checkpoints against survey control; residual plots and stats |
| Vertical RMSE | ≤ 2–3 cm facades/forensics; ≤ 3–5 cm earthworks | Accurate contours, volumes, and clash detection for decisions | Checkpoints, control report, and independent level-loop verification |
| GSD (ground sample distance) | 1–1.5 cm/pixel facades; 2–4 cm/pixel terrain | Resolves cracks, spalls, and edges for confident measurement | Flight plan math, altitude logs, and tape-checked features |
| LiDAR (light detection and ranging) point density | 200–600 pts/m² facades; 50–200 pts/m² terrain | Captures fine geometry and penetrates vegetation for completeness | Density heatmaps, stratified sampling, and voxel occupancy checks |
| Classification accuracy | ≥ 95% for key classes; ≥ 99% ground vs non-ground | Trustworthy analytics, modeling, and quantity takeoffs | Confusion matrix, precision/recall, and human spot checks |
| Coverage completeness | 100% AOI (area of interest) plus defined buffers | Avoids edge blind spots and missing elevations | Tiled footprints, overlap reports, and occlusion annotations |
| Delivery performance | < 2 seconds pan/zoom on standard workstation | Fast maps get used; slow ones get abandoned | COG (cloud-optimized GeoTIFF) pyramids, scene tiling, and tested hardware specs |
Future‑Proofing: Streaming Tiles and Digital Twins
Those COG (cloud‑optimized GeoTIFF) pyramids and scene tiles you saw in our KPIs aren’t just speed tricks. They stream from cloud storage, so maps open in 2–3 seconds while LAZ (compressed LAS point clouds) and vector tiles (styleable map layers) load progressively. Your team can mark up defects live, assign tasks, and push weekly refreshes that swap only changed tiles—no massive reuploads. The result is a living, multi‑layer model: orthos, point clouds, vectors, and notes that stay current without disrupting anyone’s workflow.
Now expand that model beyond visuals. We align to BIM/IFC (building information modeling/Industry Foundation Classes) so structural grids, electrical runs, and asset IDs match reality data (I3S/3D Tiles web‑3D formats) in EPSG:2263 (New York State Plane feet). Thermal GeoTIFFs flag moisture; air‑quality IoT (internet of things) sensors add heatmaps; SCADA/BMS (industrial control and building management) events stamp timelines. Because we stay in OGC‑aligned formats (Open Geospatial Consortium standards), your twin can ingest, compare, and alert—without rework when vendors or tools change.
Get High‑Fidelity Drone Data Into Your GIS
Ready to plug those reality‑accurate layers into your digital twin? Request a sample or book a 20‑minute data quality audit. We’ll align CRS (coordinate reference system), accuracy targets, and deliverable formats before any flight.
If façades are your focus, explore our drone facade inspection service for NYC‑ready capture, quality assurance (QA), and GIS deliverables.
Standards and Further Reading
Written by our data team, backed by standards—here are references we follow on every NYC project.
- ASPRS (American Society for Photogrammetry and Remote Sensing) Positional Accuracy Standards — accuracy classes, reporting, and checkpoint methods.
- USGS (U.S. Geological Survey) LiDAR Base Specifications — point density targets, classification rules, quality levels, and metadata.
- Esri ArcGIS Pro docs — COG (cloud‑optimized GeoTIFF), LAZ (compressed LAS), scene layers, and tile cache practices.
- NIST (National Institute of Standards and Technology) timekeeping — UTC (Coordinated Universal Time) sync for multi‑sensor capture.
Get Expert Help
Let's discuss your site and timeline
Message Sent!
Thank you for reaching out.
We'll get back to you shortly.