On This Page
January 22, 2026 10 min read
Drone-Assisted Bridge Inspections: How They Work
A practical, NYC (New York City)–ready, engineer-grade walkthrough—workflow, sensors, deliverables—with ROI, safety protocols, and compliance steps so you move from pixels to decisions in hours, not days.
When Hairline Cracks Become Headlines
Those hours matter when pixels must become decisions on a live bridge. It’s 8:10 a.m. on an East River span; a patrol spots a hairline on a gusset plate. School buses roll, traffic hums, and your phone lights up. Do you monitor, close a lane, or mobilize a snooper truck (the under-bridge inspection vehicle)? Cracks hide under steel, in shade, behind utilities. Missed calls mean overtime, closures, and risk.
By lunch, a commuter’s photo circulates and media asks what’s happening. Traditional playbook? Line up a snooper, two lanes, flaggers—often 1–3 days. We can put a drone with stabilized long-zoom optics (think 20–30x camera that reads a ruler at 100 feet) on target in 2–4 hours. The goal isn’t gadgets. It’s defensible evidence that supports a call: restrict, monitor, or repair. So why does the old playbook struggle here\
Aging assets, budget pressure, higher proof standards
Those FHWA (Federal Highway Administration)/NBI (National Bridge Inventory) numbers aren’t abstract—they tighten your NBIS (National Bridge Inspection Standards) clock. Most owners run 24‑month cycles, with fracture‑critical members checked more often. That cadence now comes with a bigger ask: defensible documentation you can share, audit, and revisit. We see DOT (Department of Transportation) reviewers expecting crisp imagery, measurable models, and trend lines that explain progression, not just snapshots.
On an NYC truss, that means zoomed close‑ups with calibrated scale bars, an ortho (map‑accurate) view for context, and a 3D model to measure a hanger’s offset to the inch. After a freeze‑thaw, you may need baseline‑vs‑follow‑up crack maps with timestamps and chain‑of‑custody notes. The goal is simple: clear evidence that supports your call.
That’s why we built a NYC‑ready program that applies the same rigor across bridges, facades, rail, and terminals through our aerial inspection services. One team, multi‑sensor capture, engineer‑first outputs.
Where the old methods break down
Under-bridge trucks (snoopers) often require two lane closures, full traffic control, and railroad flaggers when spans cross rail. Crews work at height or over water, increasing exposure. Angles are limited by rig reach, utilities, and staging. Weather, wind, or a last-minute TFR (Temporary Flight Restriction) slip schedules and ripple through budgets. In NYC, that can mean $8k–$15k per day for the snooper, plus $5k–$12k per lane per day for closures, before you capture a single image.
We've seen three mobilizations to reach one gusset: day one aborted for wind, day two paused for a VIP TFR, day three completed—36 crew hours spent. Close-range views still missed the back of plate; a follow-up was ordered. Add overtime, barge standby, and rescheduling inspectors, and a week slips. The bigger cost isn't just money—it's delayed decisions while the defect ages under live traffic.
To make the trade-offs visible, here's a quick side-by-side of legacy access methods versus a drone-enabled approach on the metrics that drive your schedule, safety, and budget.
| Dimension | Traditional methods | Drone-assisted |
|---|---|---|
| Coverage consistency | Spot checks only; angle-limited views and missed surfaces | Systematic, repeatable flight plans with full envelope coverage |
| Worker risk profile | Elevated work at height and over water | Ground-based crews using remote sensors and zoom |
| Traffic disruption | Frequent lane closures and detours | Minimal closures or off-peak short windows |
| Time on site | Multi-day mobilizations for large spans | Same-day capture for most spans |
| Cost drivers | Equipment, scaffolding, and access gear drive costs | Data capture and processing; lower access overhead |
Compounding factors widen the gap
Long spans and dense underdeck steel block GPS (Global Positioning System) and create complex sight lines. Urban rail and power introduce EMI (electromagnetic interference), while river corridors act like wind tunnels. Access pads are scarce, and heliports or stadium events trigger TFRs (Temporary Flight Restrictions). Meanwhile, documentation standards climb: model‑ready, AI‑ready (artificial intelligence) datasets with timestamps, calibration, and audit logs—not loose photos. That’s how inefficiencies compound into delays, blind spots, and repeat site visits.
Example: under a steel box girder on the Harlem River, GPS drops to zero under trusses; visual odometry and SLAM (simultaneous localization and mapping) keep position. Near active rail, magnetometer drift demands standoff and manual flight modes. Over water, gusts and shear call for wind‑rated platforms and recovery plans. Owners still expect deliverables aligned to ProjectWise (engineering document management) and Autodesk BIM 360 (collaboration) with crack logs, models, and metadata synced.
Drone‑assisted inspections that fit NYC reality
We shift risk off the structure and onto sensors: ground‑based crews, stabilized zoom for sub‑millimeter cracks, and disciplined flight envelopes. Coverage improves because we capture nadir, oblique, and close‑up sets systematically. Data is measurement‑grade—RTK/PPK control, calibrated scale bars, and known lens models—so your NBIS (National Bridge Inspection Standards) coding and AASHTO (American Association of State Highway and Transportation Officials) notes are defensible. Turnaround is days, not weeks.
Practically, that means 40–70% less field time, closures cut to off‑peak hours, and deliverables in 48–96 hours. You get orthos, 3D models, point clouds, and annotated crack maps packaged for ProjectWise and BIM 360 with chain‑of‑custody. The decision brief is plain: restrict, monitor, or repair—backed by evidence you can share with reviewers and stakeholders.
Safety first: Ground-based crews reduce work-at-height and over-water exposure
Complete coverage: Underdeck, towers, bearings, and tight bays captured consistently
Measurement-ready data: RTK/PPK photogrammetry and LiDAR deliver survey-grade geometry
Speed to insight: Faster capture, quicker processing, decision briefs in days
The Five-Step NYC Bridge Workflow
You want decisions in days, not weeks—here’s the five-step, NYC-ready process we use so you can scope it, approve it, and audit it without surprises.
Step 1: Pre-planning & permitting: Site walk; align SOW (scope of work) and hazards; check airspace—LAANC (real-time FAA authorization) and TFRs (temporary flight restrictions); secure approvals and traffic plan.
Step 2: Flight planning: Map paths and camera angles; set GSD (ground sample distance) targets; define standoff and buffer zones; plan contingencies for GPS (Global Positioning System)-denied areas and wind.
Step 3: Data capture: Underdeck flights with visual observers; progressive passes (nadir, oblique, close-up); redundancy shots with scale bars; live quality control (QC); maintain LOS (line of sight) and buffer.
Step 4: Processing & analysis: Photogrammetry (3D from photos) and LiDAR (laser scanning) pipelines; calibrate measurements; tag defects; QA completeness and metadata; output crack logs, orthos, 3D models, point clouds.
Step 5: Reporting & handoff: Prioritize restrict/monitor/repair; deliver annotated maps, models, and tables aligned to NBIS (National Bridge Inspection Standards) and AASHTO (engineering standards); host web viewer; archive chain-of-custody.
Pick the Right Payload
Those standardized paths and GSD (ground sample distance) only matter if we put the right payload on the aircraft. High-resolution RGB (red/green/blue) with stabilized zoom finds hairline cracks and spalls; oblique views expose edges and fasteners; thermal IR (infrared) screens for delamination and moisture; LiDAR (light detection and ranging) captures true shape and deformation. Mix them, and you turn photos into measurements and trends.
Which one do you use when? Start with the defect and tolerance: sub‑millimeter crack sizing needs 0.2–0.5 mm/pixel; clearance checks need LiDAR; damp spots call for radiometric thermal (temperature per pixel). Example: on a Queens approach, 30x zoom documented a 0.7 mm crack at 60 feet, while LiDAR quantified a 1.2-inch hanger offset. The thermal layer flagged a cool patch near an expansion joint; daytime visual confirmed minor seepage. Now, how do we fly these safely under steel and over water?
High-resolution RGB/zoom: sub‑millimeter cracks at 0.2–0.5 mm/pixel using 20–30x zoom and scale bars.
Oblique imaging: edges, bearings, and fasteners captured at angle; reveals laps, fretting, and hidden faces.
Thermal (IR): screen for moisture and deck delamination; confirm with daylight and cores to avoid false positives.
LiDAR: true-to-shape point clouds; clearance and camber checks underdeck; works in GPS-denied interiors.
Safe Ops Under Steel, Over Water, In NYC Airspace
That LiDAR in GPS‑denied interiors only pays off if we can hold position when satellites go dark. We switch to visual positioning (cameras track texture) and optical flow (motion cues) to stabilize close-in flight. Prop guards (protective rings) and collision sensing (proximity sensors) add bump tolerance. RTK baselines (a ground station that corrects GPS drift) anchor mapping shots when sky view returns. Tethered observers (spotters on fixed posts with radios) maintain line of sight. Redundancy matters: dual media, mirrored SDs, so you get predictable data. Abort if link degrades, sensors disagree, or winds exceed aircraft limits. No hero shots.
Under steel where magnets and rail induce EMI (electromagnetic interference), we fly manual with greater standoff and test collision sensors first. Over water, we pre‑brief recovery, set crosswind limits, and add float kits; example: on a Harlem River span, gusts hit 22 mph and we paused until 15. Night ops use anti‑collision beacons, down‑lighting, and a noise/light plan for neighbors. For tight bays, we deploy caged drones with SLAM (simultaneous localization and mapping) and a 3‑meter buffer. Every mission has hard stops: loss of two sensors, compass/magnetometer error, or repeated optical‑flow dropouts.
NYC adds Class B (busy airport) shelves, heliports, stadium TFRs (temporary restrictions), and security overlays. We plan with LAANC (real‑time FAA approvals), agency permits, and geofencing management led by our NYC airspace authorized drone pilots. With authorizations squared away, you get the benefit: safe capture that feeds decision‑ready deliverables next.
Brief the team: confirm roles, radio channels, and mapped no‑fly zones.
Stage equipment: wind‑rated aircraft, spare batteries, backup media, tools.
Secure the site: traffic control, barricades, and protected drop zones.
Monitor conditions: wind, EMI (electromagnetic interference), satellite navigation (GNSS), battery health.
Document everything: flight logs, approvals, calibrations, and any anomalies.
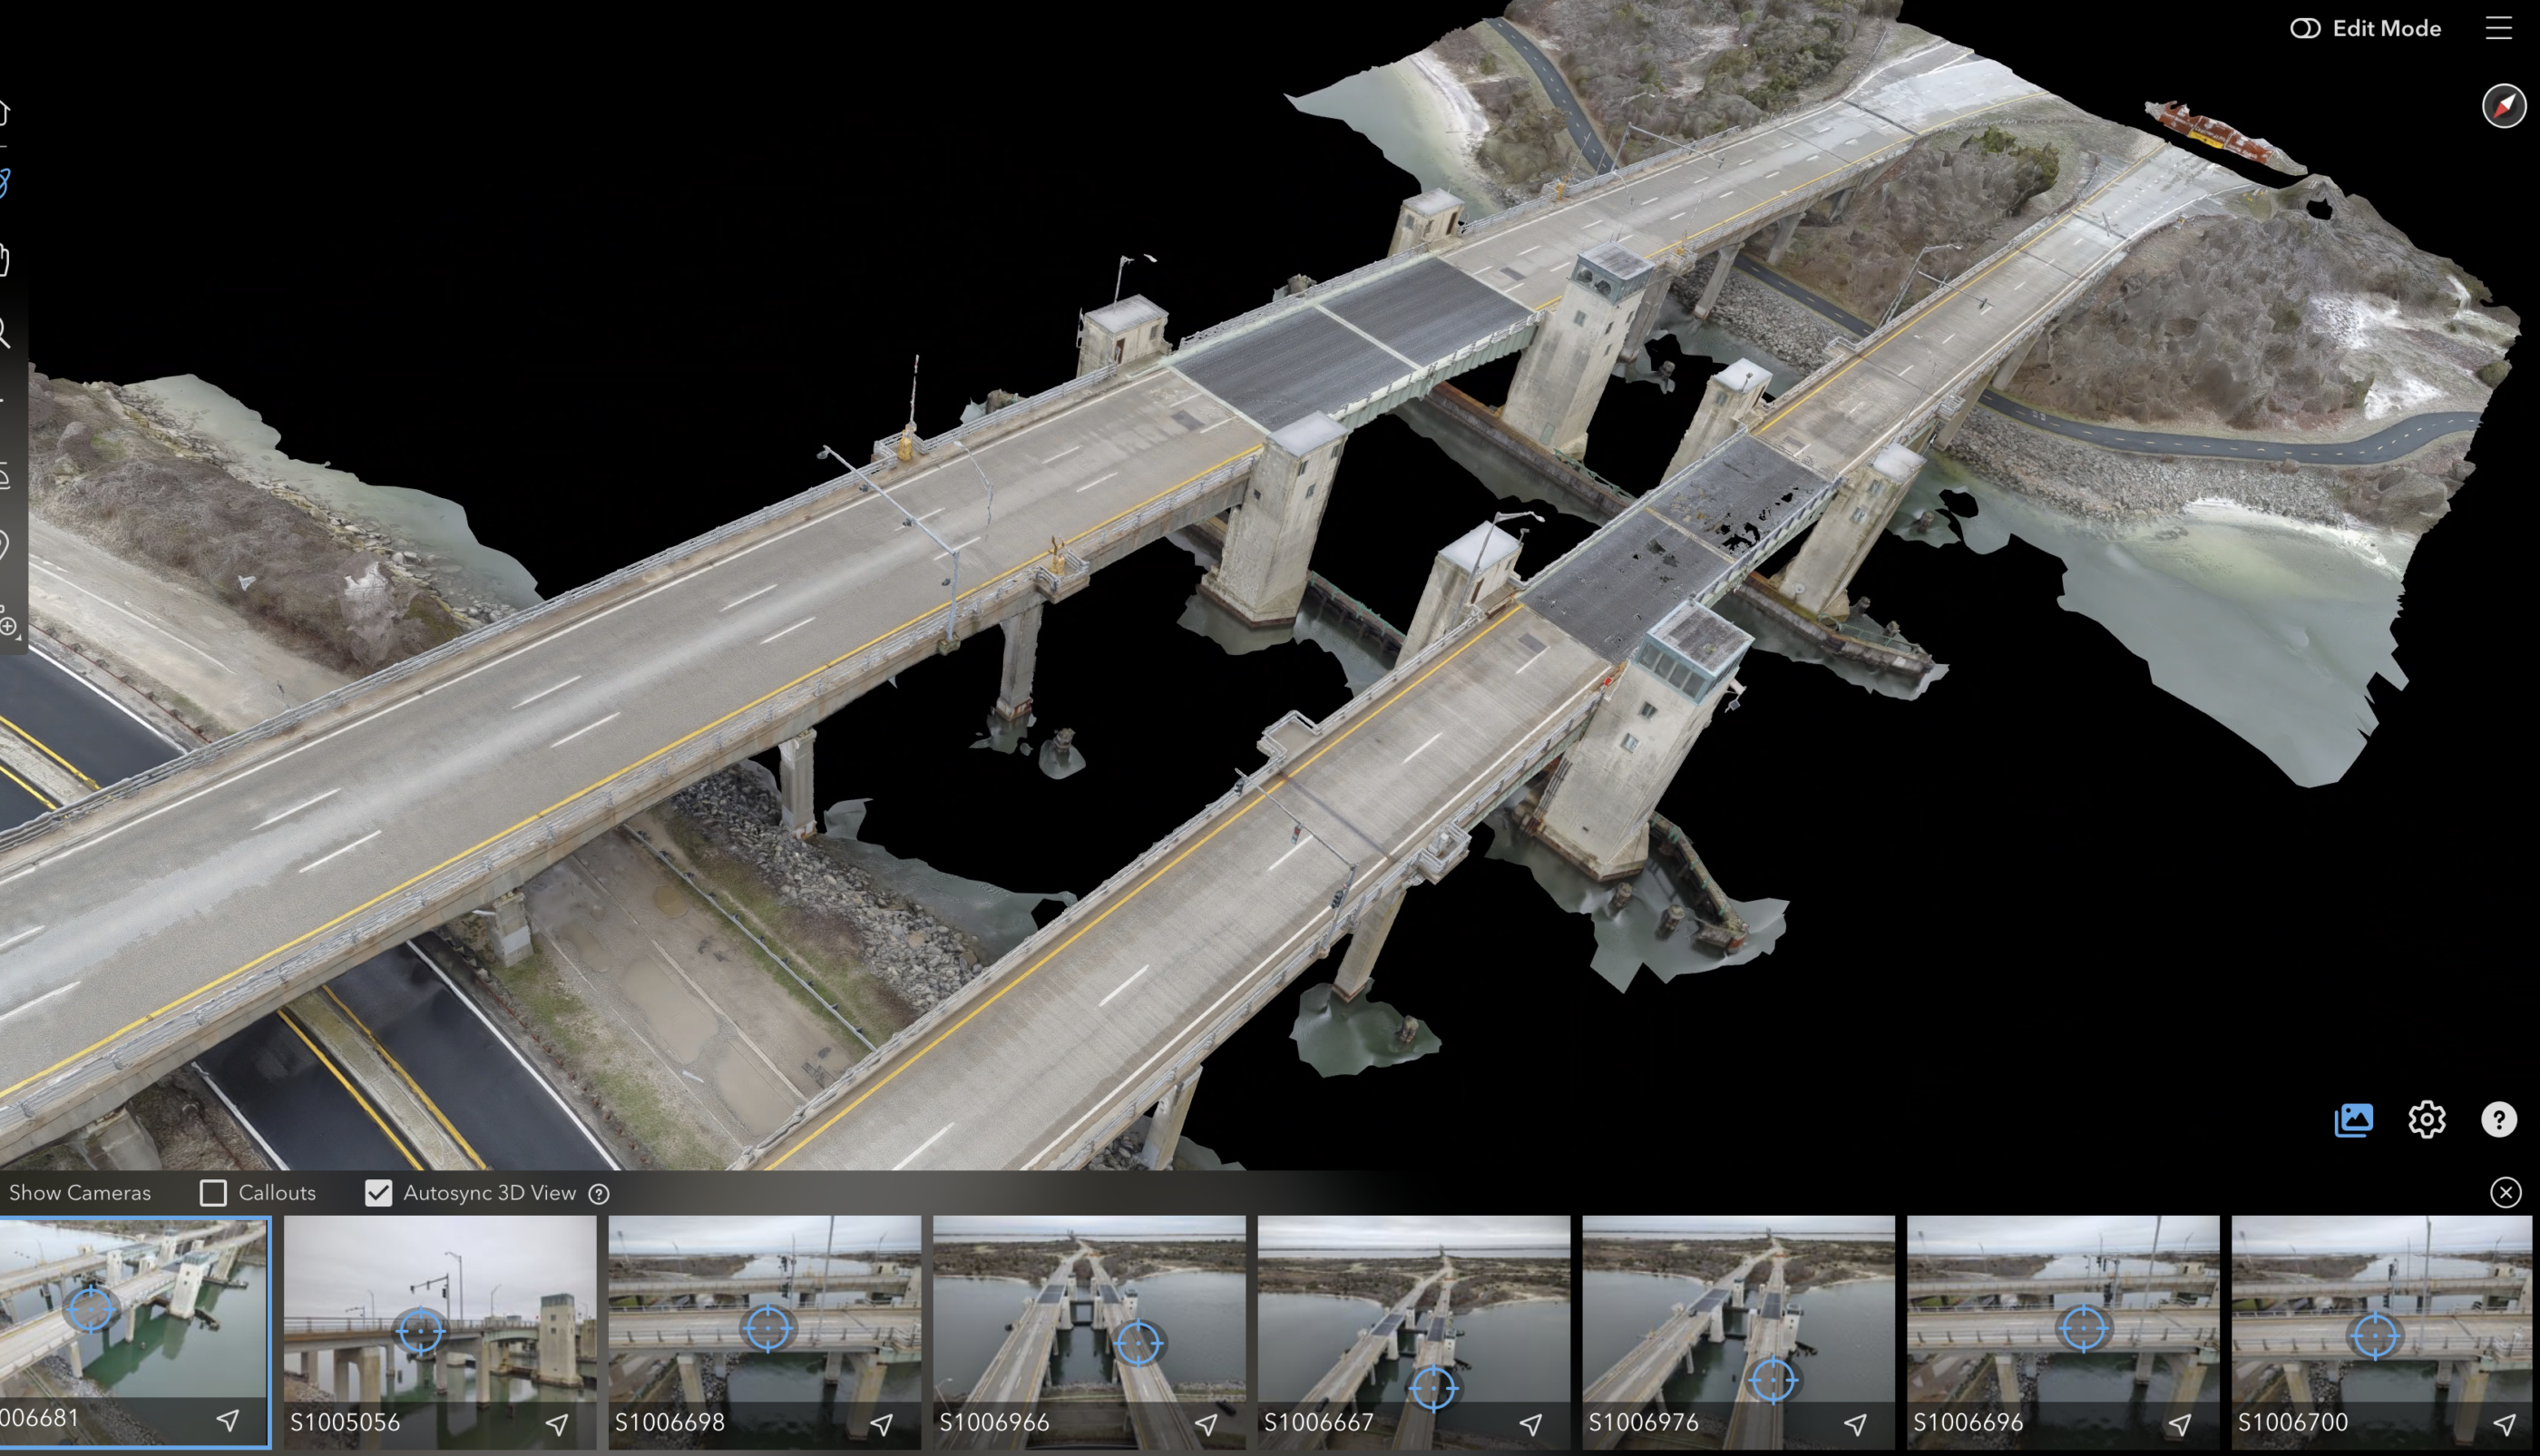
From Capture to Call: Decision-Ready Deliverables
You documented everything—here's how those files become decisions, mapped from deliverable to user to action; see the map below, then a quick NYC (New York City) case with the numbers.
| Deliverable | Used by | Enables |
|---|---|---|
| Annotated defect photo logs with measurements | Inspectors and PEs (professional engineers) | Prioritize repairs and track trends over time |
| Orthomosaics (map-accurate images) and point clouds (laser scanning/3D from photos) | Survey and design teams | Dimensional checks and clash detection in CAD (design software) models |
| 3D underdeck models (mesh and point cloud) | Asset managers | Clearance analysis and maintenance planning |
| Thermal maps (radiometric infrared) | Maintenance | Targeted follow-up validation of anomalies |
| Issue register with severities and locations | Project managers and owners | Budgeting and scheduling across programs |
72-Hour Turnaround, 48% Savings: NYC Truss Case
Those accuracy reports and chain‑of‑custody logs you just saw aren’t paperwork—they won rapid sign‑off on a Queens steel truss. Scope: rehab triage on five spans over tidal water, live traffic, and an adjacent rail line. Constraints: Class B (busy airport) shelves and limited launch zones. We flew a one‑day mission: 30x stabilized RGB (color) zoom for sub‑millimeter cracks, full‑frame photogrammetry (45‑megapixel images) for models, LiDAR (laser scanning) for clearances, and radiometric thermal (temperature‑per‑pixel) for moisture. Results: 12.5 site hours, 96% coverage, two 0.6–0.9 mm cracks, one loose hanger nut, and a cool joint flagged for follow‑up.
Traditional plan was UBIT (under‑bridge inspection truck) plus swing stage: four days, two lanes closed 10 hours/day, rail flaggers, and a barge on standby. Our drone capture cut field time 68% and lane closures to one lane for 6 hours off‑peak. Direct costs dropped an estimated 48%, and first deliverables landed in 72 hours with measurement reports and QA logs. The decision brief was clear: monitor the two micro‑cracks, tighten the hanger, and schedule sealing at the flagged joint. Now, what does that mean in dollars? Let’s run the ROI math next.
For rehab phases, we fold the same workflow into progress monitoring—monthly capture, change detection, and punch‑list validation—via our drone construction inspection approach, so you see issues early and keep schedules honest.
Budget the Payback, Not Just the Price
So does that monthly capture and change detection pay off—here are the ROI (return on investment) drivers with NYC (New York City) example ranges; your numbers vary by span type and agency.
| Driver | Effect | Example impact |
|---|---|---|
| Reduced access equipment | Cuts direct costs | -20–40% vs. scaffolding/barges |
| Faster capture-to-report | Compresses schedules | Days to hours for small spans |
| Fewer lane closures | Lowers traffic control costs | Off-peak or no closures |
| More defects identified | Avoids future failures | Earlier remediation prevents escalations |
| Trendable data | Optimizes maintenance | Condition forecasting improves planning |
Example: Traditional UBIT (under-bridge inspection truck) 2 days @ $12k/day = $24k; traffic control 2 lanes, 2 days @ $8k/day/lane = $32k; flaggers $3k/day × 2 = $6k; total $62k. Drone mission $9k + one off-peak lane $5k = $14k. Savings $48k; ROI = (62–14)/14 = 3.4x; payback in the first inspection cycle. Next: approvals and risk controls in NYC.
Compliance that unlocks ROI and reduces risk
1. ROI real—approvals: we handle FAA (Federal Aviation Administration) filings, NYC DOT OCMC (traffic permits), MTA (transit) and USCG (Coast Guard) coordination, and documentation so your NYC (New York City) flight gets yes and audit-ready data.
2. FAA Part 107: Remote ID (broadcast ID), LAANC (real-time approvals), and waivers for controlled airspace or specialized missions.
3. Night/over people: Night training, anti-collision lighting, OOP (operations over people) approvals, and ASTM F3322 parachute systems.
4. Data governance: Chain of custody, checksums (file integrity codes), encryption, role-based access, retention schedules, owner-controlled permissions.
5. DOT (Department of Transportation) acceptance: Accuracy reports, calibration logs, traceable deliverables aligned to AASHTO/NBIS (bridge standards).
6. Insurance & liability: COIs (certificates of insurance), $5M–$10M limits, additional insureds, waivers of subrogation, incident response plans.
Your First Drone Bridge Inspection: A 30‑Day NYC Plan
With insurance, permits, and risk controls in place, here’s a simple 30‑day plan covering scoping, safety, and deliverables—so you get a defensible decision fast and extend it to facades next.
Week 1 – Scope: Define elements, objectives, and tolerances; review sample outputs; share CAD (computer‑aided design)/as‑builts; set accuracy targets: 0.5 mm cracks, 1 in clearance.
Week 2 – Permits: Confirm airspace authorization and sign‑off; coordinate NYC DOT (Department of Transportation) traffic plan; arrange railroad and Coast Guard notices; finalize safety plan.
Week 3 – Pilot test: Fly one bay; run quality control (QC); verify crack sizing and clearance; deliver sample model and crack log in 72 hours.
Week 4 – Scale: Standardize naming, flight plans, and QA/QC (quality assurance/quality control); save repeatable templates; enable change detection; publish a playbook for teams.
Vendor checklist: NYC airspace fluency; insurance and COIs (certificates of insurance); fracture‑critical experience; zoom, LiDAR, thermal; NBIS/AASHTO reporting; chain‑of‑custody; 72‑hour turnaround; verifiable references and sample deliverables.
From Bridges to Facades: Same Rigor, Faster Decisions
That vendor checklist you just ran through carries straight over to facades. Same airspace fluency, same chain-of-custody, same 72-hour turnarounds—just vertical. FISP (Façade Inspection Safety Program) and LL11 (Local Law 11) still need close-range evidence without putting people on every drop. Access is tricky: street canyons, setbacks, scaffolds, and sidewalk sheds. We pre-plan flight boxes like “Stack A–D, Zones 1–10,” lock GSD (ground sample distance) at 0.5 mm/pixel for crack sizing, and repeat those passes each cycle. Example: on a 12‑story masonry facade, we fly Stack B, Zones 3–6 in a 4‑minute oblique pass, then a normal-to-wall mosaic for measurement. Repeat paths next quarter give clean change detection. You get apples-to-apples comparisons.
Scheduling and QA feel familiar too. You still juggle permits, sidewalk sheds, and off-peak windows—coordinated with NYC DOB (Department of Buildings) instead of lane closures. We set lighting windows to avoid glass glare, place calibrated scale bars on balconies or setbacks, and log timestamps to the second. Example: a 30‑story curtain wall needed four swing-stage drops; drone triage cut that to two targeted drops, saving 2–3 nights of labor while flagging 0.3 mm cracks for hands-on verification. Every package ships with coverage maps, accuracy reports, and a defect register tied to elevation grids. The result is predictable reviews and fewer surprises for the QEWI (qualified exterior wall inspector).
Planning LL11 (Local Law 11) triage? Explore our drone facade inspection service for NYC-ready capture and deliverables.
Portfolio Programs That Keep Schedules Honest
If LL11 (Local Law 11) triage is on your mind, the next move is scaling the same rigor across every building you manage. We standardize orthomosaics (map-accurate wall images), 3D models, and defect logs into one schema, so your teams compare apples-to-apples across campuses. That means condition indices by elevation, crack progression charts by zone, and risk heatmaps you can brief in 10 minutes. Example: a 22‑building portfolio moved to semiannual cycles; emergency facade calls dropped 17% and budget variance tightened to ±5%. No guesswork. You get trend lines, not one-off photos—and a defensible record you can hand to auditors.
Coordinating 10 addresses in NYC is half the battle, so we centralize it. One master calendar aligns DOB (Department of Buildings) notifications, sidewalk-shed windows, and tenant access with our flight slots, cutting repeat mobilizations. We pre-load COIs (certificates of insurance), security protocols, and lobby communications, then assign standard naming and floor/elevation grids for every site. Result: four weekend capture windows replace 30 scattered visits, and your PM (project manager) sees status in a single dashboard via BIM 360 (Autodesk collaboration) or your CMMS (computerized maintenance management system). Wondering about accuracy, approvals, winter wind, or night noise? We answer those in the FAQs next.
Ready to standardize at scale? Our drone building inspection program turns buildings into comparable datasets you can schedule, trend, and budget.
Bridge Inspection FAQs
Ready to standardize at scale? Before you schedule the first span, here are quick answers on operations, accuracy, weather, cost, approvals, and timelines—so you know what to expect.
- How accurate are the measurements?: RTK (real-time kinematic) plus GCPs (ground control points) achieve 1–3 cm; crack sizing ±0.5 mm. Without control, 5–8 cm.
- Can you inspect under the deck?: Yes—zoom, oblique passes, and caged drones; SLAM (simultaneous localization and mapping) holds position; scale bars support measurement.
- What about wind and weather?: No‑go: sustained >22 mph, gusts >10 mph delta, rain or icing.
- Mitigations: wind‑rated aircraft, crosswind limits, pauses, alternate windows.
- How long until we get the report?: Same‑day triage for urgent calls; standard deliverables in 48–96 hours; complex LiDAR (laser scanning)/thermal fusions 3–5 days.
- Do DOTs accept drone data?: Yes—when QA/QC (quality checks) and metadata meet NBIS/AASHTO. DOTs (state Departments of Transportation) require chain‑of‑custody.
- How do you price a job?: Scope, sensors (zoom, laser scanning, thermal), airspace, traffic control, rail/USCG (Coast Guard) coordination, and deliverables/turnaround drive cost.
- Who owns the data?: You do. We act as custodian—chain‑of‑custody, encryption, defined retention. Access is owner‑controlled; web viewer or offline hard drive, per policy.
- Do you coordinate traffic control?: Yes—NYC DOT (Department of Transportation) permits, flaggers, off‑peak windows, and railroad/USCG (Coast Guard) notices coordinated with your team.
Get Your Tailored Plan and Sample Report
With traffic control and approvals covered, let’s scope your first span. In 20 minutes, we’ll map objectives, risks, and budget bands, then share sample deliverables you can circulate. Since 2018, AeroSpect NY has completed 200+ NYC (New York City) missions—bridges, facades, and rail corridors. You’ll see safety controls, a fast 30‑day schedule, and cost scenarios side‑by‑side with traditional access. No guesswork. Just a plan you can approve.
Standards, Sources, and Credibility
Before you request your bridge inspection plan, review these reputable sources we align with: FHWA, AASHTO, FAA, NIST, peer‑reviewed studies, and DOT pilots.
- FHWA bridge inventory data
- AASHTO inspection manuals/guides
- FAA Part 107 resources
- NIST measurement/accuracy papers
- Peer-reviewed UAS inspection studies
- DOT case reports or pilots
About Our Operations Lead
Those DOT (Department of Transportation) case reports and pilots have my fingerprints—I lead operations at AeroSpect NY and hold an FAA (Federal Aviation Administration) Part 107 Remote Pilot certificate, with 6+ years in NYC airspace and 200+ missions since 2018. I’m trained for night operations, OOP (operations over people), and radiometric thermography (temperature‑per‑pixel thermal imaging), with recent work on East River spans, Harlem River rail corridors, and LL11 (Local Law 11) facades. Happy to share sample outputs.
Get Expert Help
Let's discuss your site and timeline
Message Sent!
Thank you for reaching out.
We'll get back to you shortly.